Third Quarter 2020 Market Review
Asset Allocation, Meet TINA
After erasing early losses and, in the case of the Nasdaq Index, hitting new record highs, the market, as measured by the S&P 500 Index, ended September in the red.
Talking heads will point to various issues including shutdowns, no additional stimulus, COVID19 spikes, and the election. The explanation could simply be that a small number of stocks that drive the returns of the S&P 500 and the NASDAQ indices just went too far, too fast and were victims of the long-honored tradition of profit-taking.
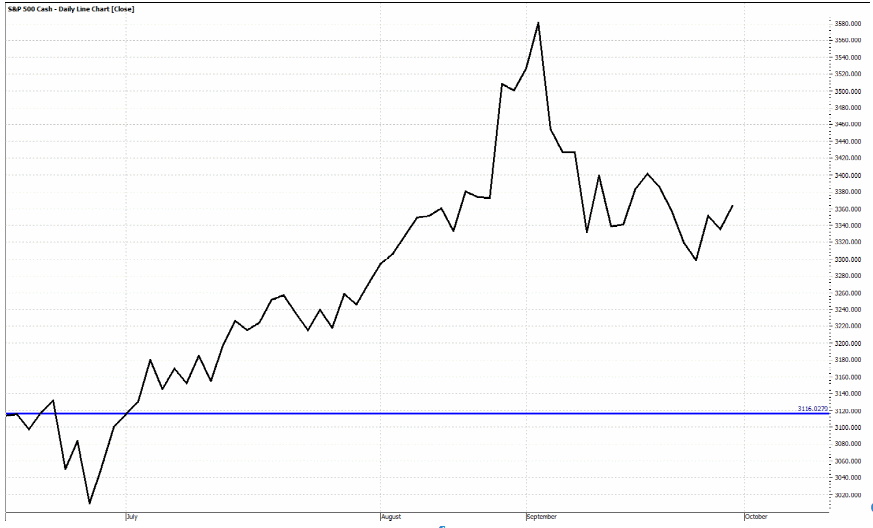
S&P 500 July-September 2020
Ever since the pandemic driven market melt-down earlier this year, we have been experiencing a price recovery in growth and income investments that is curiously uneven. To illustrate this, look at two popular ETFs and their performance so far in 2020. Below we see the chart for the SPDR S&P 500 ETF (SPY with a 1.8% dividend yield) versus the SPDR S&P Dividend ETF (SDY yielding 3.5%).
The SPDR S&P 500 ETF Trust seeks to provide investment results that, before expenses, correspond generally to the price and yield performance of the S&P 500®Index which holds large-cap companies across eleven sectors.
The SPDR S&P Dividend ETF seeks to provide investment results that correspond generally to the total return performance of the S&P High Yield Dividend Aristocrats Index which screens for companies that have consistently increased their dividend for at least 20 consecutive years, and weights the stocks by yield. Stocks included in the Index have both capital growth and dividend income characteristics, as opposed to stocks that are pure yield.
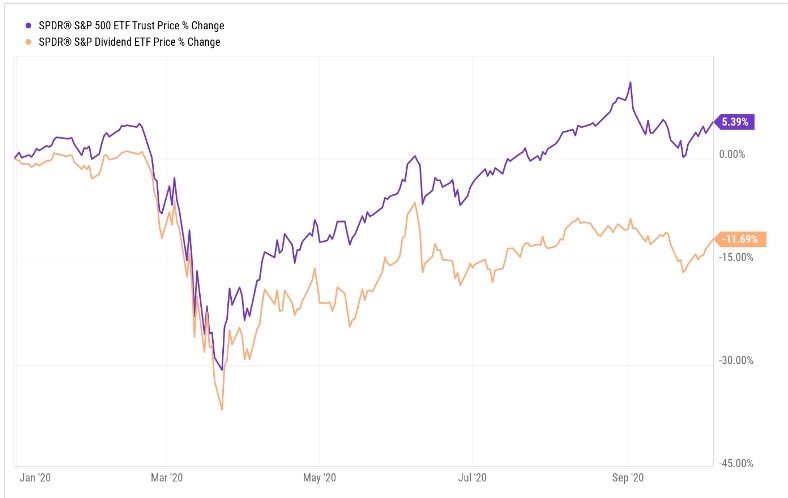
SPDR S&P 500 ETF vs SPDR S&P Dividend ETF
We addressed this earlier in the Market Insights post, “The Market is Up, Why Isn’t my Account?”
In that article we wrote:
“As an example, the Dow Jones US Select Dividend Index (DJDVP) represents the stock performance of the US’s leading dividend-paying stocks and sports a current dividend yield of 5.15 % versus 1.86% for the SPX. The DJDVP is still down over 21% year to date.”
We use the term “curiously” when looking at these results because, at a time when 10-Year Treasuries are yielding less than 1%, we are now living in the age of TINA. Have you heard of TINA?
No, not Tina Turner…
On Wall Street, there are hundreds of acronyms that traders use every day:
- DFTF stands for “Don’t Fight the Fed”
- SIM stands for “Sell in May”
- BTD is code for “Buy the Dip”
And P&D refers to the “Pump and Dump” practice of hyping a stock in the media before selling it in the market.
These days, there’s a new acronym, TINA, and it stands for “There Is No Alternative!”
Today’s market leaves investors with fewer options for protecting and growing their wealth. And it all ties back to the Fed’s aggressive zero interest rate policy.
TINA refers to the current phenomenon of investors allocating most of their capital to the stock market because of the lack of yield in the bond market. And this trend will continue for as long as the Fed keeps manipulating the bond market.
In the face of historically low interest rates, we would expect to see money flowing into financially strong, dividend-paying companies and Real Estate Investment Trusts. To date however, the money continues to flow into the tech stocks as indicated by the performance of the FAANG stocks as well as the Tech-heavy NASDAQ 100.
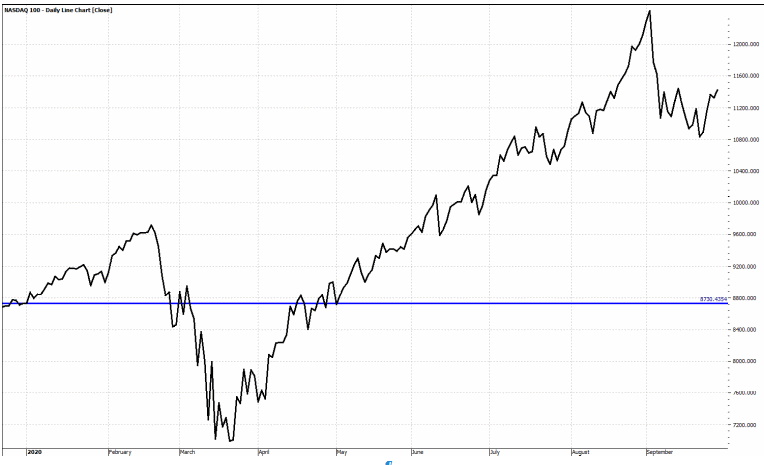
NASDAQ 100 Stock Index
It is frustrating to see a dividend-heavy account still down on a price basis. But, as long as we are vigilant and remain confident that the dividends paid by these investments will continue, we’ll be happy reinvesting at a higher yield. At some point, history suggests that investor demand for yield to replace that formerly provided by maturing bonds is likely to drive prices for the best run dividend paying companies higher.
Fourth Quarter Expectations
Just as we alluded to in the second quarter letter, we believe that short term volatility will be driven by two factors:
The virus
The election
The Virus
In our opinion, both subjects above could now be filed under the heading “Politics”. Depending on where you live and how much news you consume, the pandemic is either over, or just getting ready to get worse.
In our Q2 letter we wrote about the two key metrics for the virus: the infection rate, and the fatality rate. We said:
“The first thing most experts want to know about a virus is the infection rate (R0). This number tells them how many people in a population are likely to get infected.
“A simple internet search will show you that of the several thousand viruses circling the planet this very moment, most have an R0 of less than one which means that they are not very infectious. Regardless of what anyone tries to tell you, at this point in time the R0 for the Coronavirus is still unknown. There is simply not enough data to make a reliable determination.
“The other most important piece of information is the fatality rate of the virus. This number conveys the likelihood of someone who has been infected succumbing to the virus.
“Even dismissing other variables such as age, gender, pre-existing conditions, access to medical care, genetics and anything still to be determined as contributing factors, we do not have a clue what the real fatality rate might be.”
Remember we also wrote about a rule of thumb that the more infectious a disease is, the less deadly it usually is. That seems to be consistent with the data we have access to on the Covid19 virus.
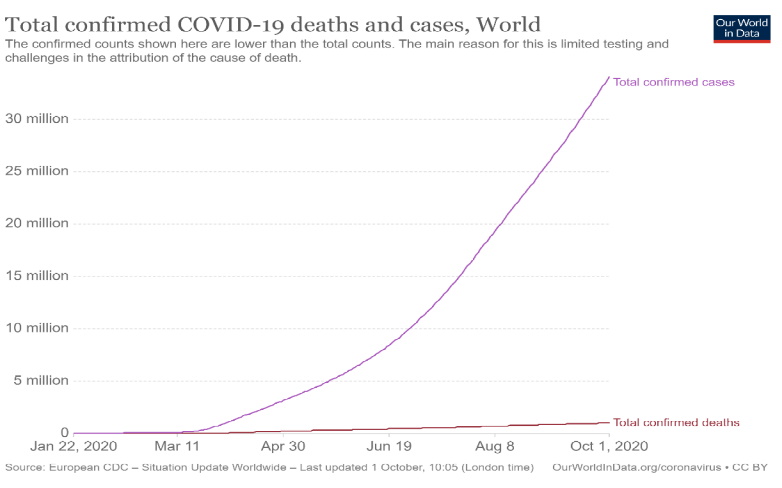
While there is certainly much more data than before, we still do not know very much about the virus and the picture is becoming increasingly muddled. There continues to be ongoing debate over the testing methods, the reporting of cases, hospitalizations, deaths, etc. and very recently a Harvard epidemiologist published a paper regarding the sensitivity of the tests being used in mass-testing situations like college athletes who are being subjected to frequent, even daily testing.
“In three sets of testing data that include cycle thresholds, compiled by officials in Massachusetts, New York and Nevada, up to 90% of people testing positive carried barely any virus, a review by The New York Times found.”
Think about that for a moment! Many states, including California, have begun primarily using new case numbers as their benchmark for opening and closing their economies.
And then there’s Sweden which never locked down the way we did but, instead, invested resources to protect the most vulnerable citizens as more and more data became available.
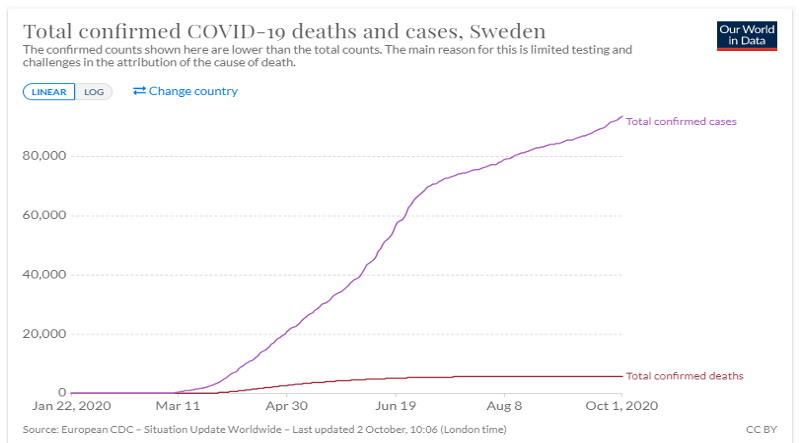
While we certainly want to know more about this disease to protect and maintain our health and that of our loved ones, as investors the issue is the impact of the virus on the economy. We have all seen the meme going around about being in the sixth month of the two-week shutdown to “flatten the curve”. However, when it comes to the impact on the economy, this is no joke.
While employment has recovered substantially since the April spike, we see that unemployment is still stubbornly above February 2020.
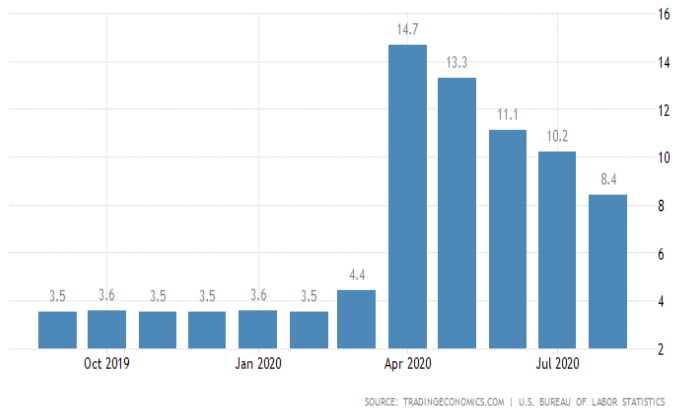
US Unemployment Rate through August 2020
This is primarily due to public policy driven by data, as mentioned earlier, that the politicians are accessing where some states are fully reopened, some are still mostly closed, and most are sitting somewhere in between.
When highly populated states such as California, which until recently didn’t even allow haircuts for anyone other than elected officials, are severely restricting business activity, we risk prolonged and even permanent economic damage to the country.
Are these actions of state officials political in nature? It’s a hard argument to make when the two largest states, California and Texas, are controlled by different parties. We do find it remarkable how the goal of government actions has evolved from flattening the curve, to slowing the spread, to containment, to suppression, and now seems to be to stop the virus completely. It’s impossible to know if these changes can be chalked up to human nature and ignorance rather than an intentional desire to do harm for political advantage.
Regardless, just like the hyper-regulatory environment, lock downs and shutdowns throw a wet blanket on economic activity and growth. Economic activity is the driver of growth and prosperity which leads to higher valuations in the businesses that are effectively participating. Government stimulus spending can give a temporary boost to prices but in the long run that stimulus usually benefits a connected few businesses or industry sectors.
The only way to get back to the economic health and growth we have seen in the last four years will be to remove impediments of both state and Federal government overreach. Sadly, it’s probable near-term uncertainty will continue until progress is made in treatment and/or vaccines. Therefore, the short-term recovery will still depend largely on monetary policy (the Fed) and ongoing fiscal stimulus (the Federal government).
As stated earlier, we continue to work hard to identify those sectors that are least impacted by the current environment and then identify the strongest companies within those sectors for investment. Regarding REITs, we try to own those that will be able to collect a high percentage of rent due (for example, 90+%) rather a significantly reduced percentage (say 60%). While this may result in portfolio changes, we have found that many of the sectors and companies that performed well pre-pandemic are those that continue to deliver today.
The Election
We almost hate to write about this. In personal conversations I have told the story about my first election in 1964.
Walking to school, one of my classmates asked who my parents were voting for. When I revealed my ignorance, he explained that it was election day and that our parents were supposed to vote for president. Pretty much none of us in our little group had a clue and we quickly moved on to subjects that were more important to first graders.
Later that day, I asked my mother about it. She acknowledged that there was an election that day, that she and my father did vote, and that it wasn’t anybody’s business who they voted for. Voting was a private, personal choice and it was in everybody’s interest to keep it that way. Oh, how we long for those days! Many people are now so emotionally involved on the subject of politics that it is impossible to have a rational conversation on the topic.
We won’t go much further into politics as, just like the virus, we want to focus on what we can control, which is the construction of our portfolios. In our opinion (always subject to change), a Trump victory would continue to favor the financial, defense, construction, manufacturing, healthcare, pharmaceutical and traditional energy sectors. A Biden victory would favor alternative energy, education, financials, infrastructure, healthcare, and service industries. It would also favor large, multi-national corporations that could absorb the proposed corporate tax hikes as well as use an anticipated increase in regulations as “moats” around their businesses to protect pricing power.
Interestingly, Trump’s signature tax reform in 2017 lowered the corporate tax rate from 35% to 21% which was great for traditional corporations. But it made special tax shelters like REITs less attractive by comparison. REITs are not required to pay federal taxes so long as they distribute at least 90% of their profits as dividends.
Joe Biden’s tax plan would raise corporate taxes back to 28% and would more aggressively tax foreign income. It also is specifically designed to force large, profitable tech companies to pay more. All of this bodes poorly for the stock market. But it may not be such a bad thing for REITs. Their special tax status might once again be appreciated.
In either administration, we see a continuation of growth in the technology sector with a Biden administration favoring the large established companies such as Google, Amazon, Facebook and Apple while a Trump administration would continue to try to make it easier for smaller companies to compete.
So regardless of the outcome, which might make Bush vs. Gore look like a playground spat, we will be ready to make adjustments as needed to try to achieve the best possible long-term investment outcomes.
In conclusion, we expect short term volatility to continue as the pandemic and election news drive the trading algorithms into buy or sell mode with each new headline. But it is the long-term that we concern ourselves with.
Twenty years from now, neither of the Presidential candidates will be in office but a well-thought out investment strategy should continue to provide a reliable stream of income even if the world around us seems increasingly unreliable.
As always, we welcome your calls and questions and look forward to helping you through the next four years whatever challenges they may bring.


