
Independence Day 2024 Edition
We are writing our Q2 letter from a place we nick-named “The Compound”, an isolated area in Independence Township, Michigan where the world seems to slow down, even if it’s for just a few days each year.

This is our twentieth year coming here to celebrate the 4th of July and while lots of things have changed through the years, the peace and joy of this week is the same as ever.
Q2 was a bumpy ride for the stock market as the major indices finishing the quarter mixed with the Nasdaq reclaiming the top spot while the Dow 30 ended slightly lower than it started.
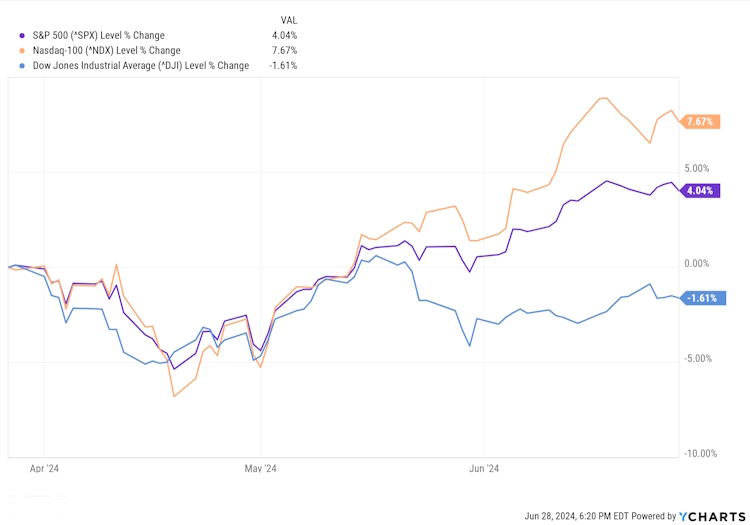
Year to date, all indices are up, although the Dow substantially lags the S&P and Nasdaq.
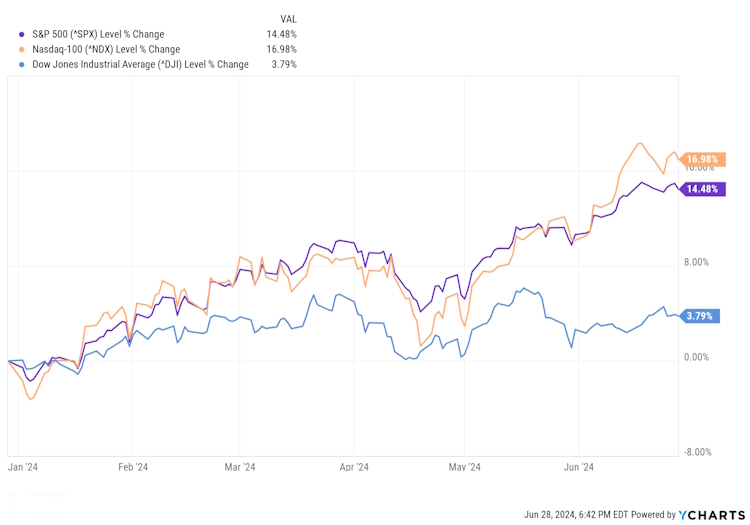
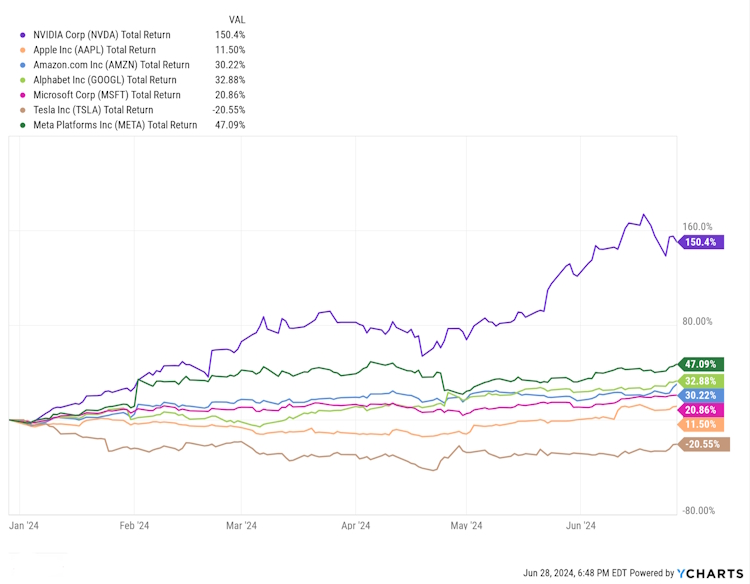
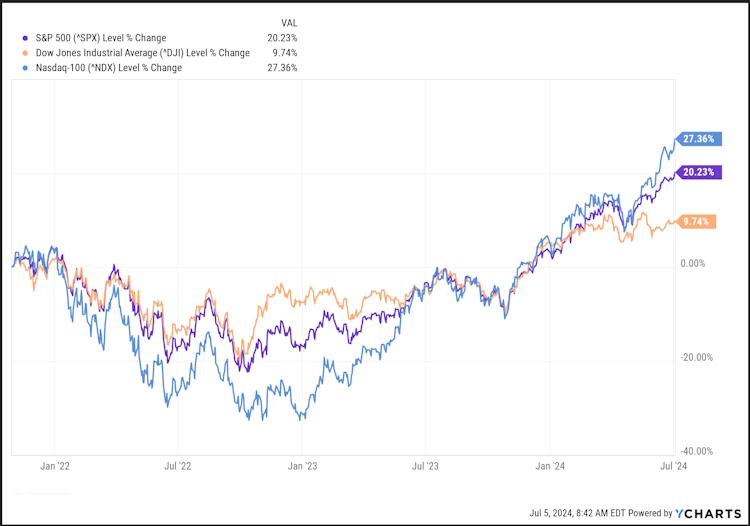
The explanation for this is similar to 2021 when the cap-weighted S&P 500 diverged from the equal-weighted index, driven by the “Magnificent 7:” NVIDIA, Amazon, Apple, Meta, Google, Tesla, and Microsoft.

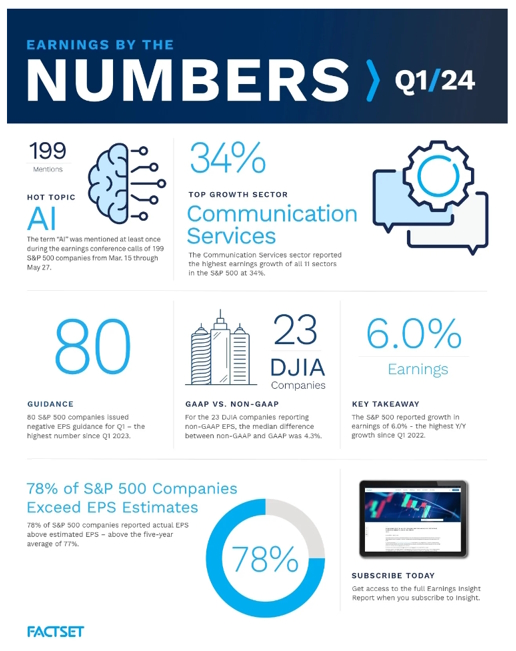
So, as we can see from the chart, the rally has been concentrated in a small number of names and unless your portfolio has similar concentrations, the returns of most stocks are much closer to the orange line. This is happening even though the earnings reported during the early part of the quarter were positive overall.
Looking at the economy, the Conference Board Leading Economic Index® (LEI) for the U.S. decreased by 0.5 percent in May 2024 to 101.2 (2016=100), following a 0.6 percent decline in April. Over the six-month period between November 2023 and May 2024, the LEI fell by 2.0 percent—a smaller decrease than its 3.4 percent contraction over the previous six months.
The May numbers were driven primarily by a decline in new orders, weak consumer sentiment about future business conditions, and lower building permits.
According to Justyna Zabinska-La Monica, Senior Manager, Business Cycle Indicators, at The Conference Board. “While the Index’s six-month growth rate remained firmly negative, the LEI doesn’t currently signal a recession. We project real GDP growth will slow further to under 1 percent (annualized) over Q2 and Q3 2024, as elevated inflation and high interest rates continue to weigh on consumer spending.”
Speaking of Inflation, the May Consumer Price Index (CPI) remained flat over April and rose 3.3% over the prior year — a deceleration (not a drop) from April’s 0.3% month-over-month increase and 3.4% annual gain in prices. Both measures came in lower than economist expectations and had the lowest monthly headline reading since July 2022.
A decline in energy prices, led by a drop in gas prices, contributed to further downward pressure on headline CPI.
The “core” index, which strips out costs of food and gas, showed prices in May climbed 0.2% over the prior month, the lowest monthly core reading since June 2023, and 3.4% over last year, again lower than economist estimates.
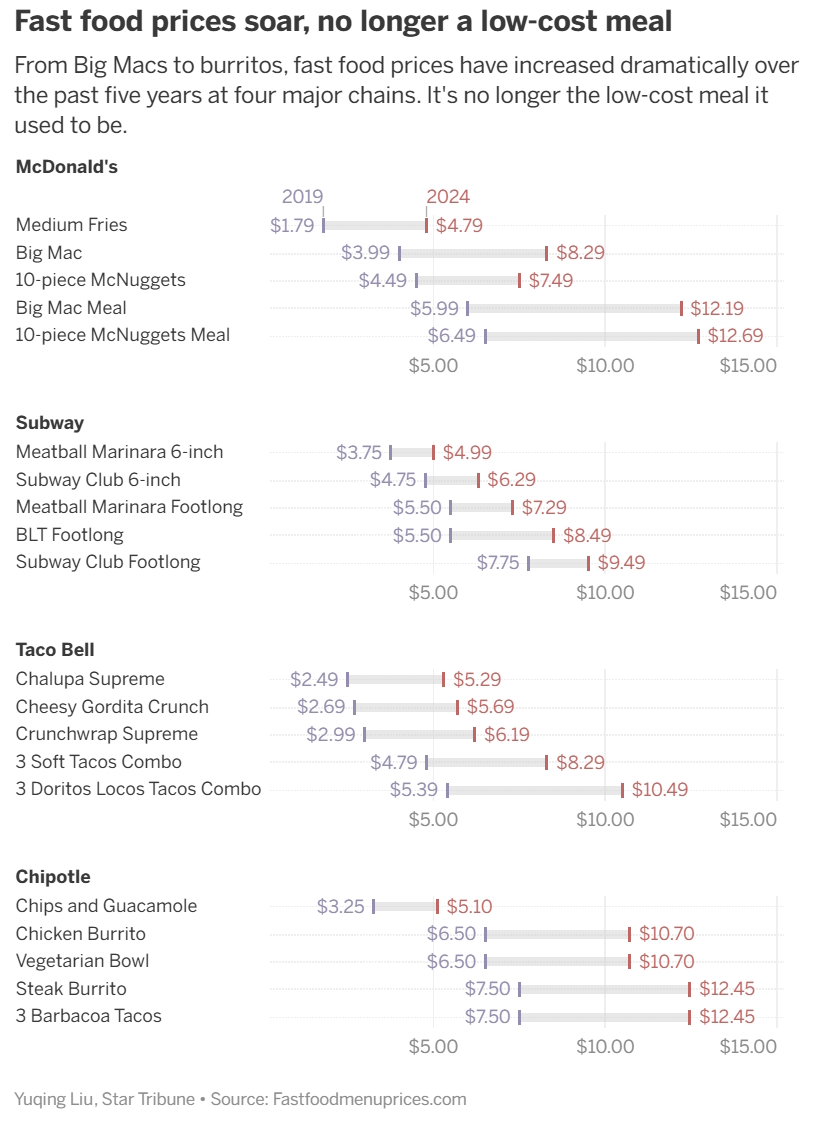
Of course, “official” government numbers don’t always reflect the experience of the average citizen. Several years ago, the “Big Mac” index was developed to measure the impact of inflation on lifestyles across the globe as McDonald’s has restaurants throughout the world. The website Fastfoodmenuprices.com has taken the Big Mac Index a step further.
While these numbers will have no influence on Fed policy, they very much have an influence on our retirement planning decisions and how we should be allocating our investments to prepare for when we no longer have a paycheck.
A new study published by Northwestern Mutual found the “magic number” that Americans believe they need to retire comfortably hit $1.46 million this year, the highest level on record. The figure represents a nearly 15% jump from the $1.27 million that Americans said they needed in 2023, easily outstripping the current 3% inflation rate in the country.
Over the past five years, Americans’ “magic number” has surged 53% from the $951,000 reported in 2020, according to the financial services firm. We don’t know how those surveyed derived those numbers; many of them likely haven’t gone through any detailed analysis like a Financial Snapshot. Still, it is telling that many people are feeling the impact of rising prices, and that impact is weighing on their views of retirement.
And Then There Was One
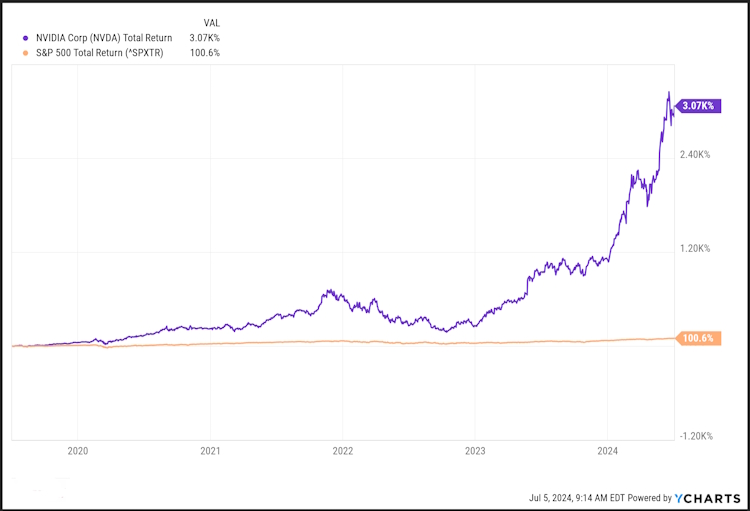
While the Magnificent 7, had carried the S&P and Nasdaq indices for most of 2023 we started to see that trend dwindle in the first quarter and it continued in Q2 with a clear separation between NVIDIA and the rest.
Can NVIDIA defy history?
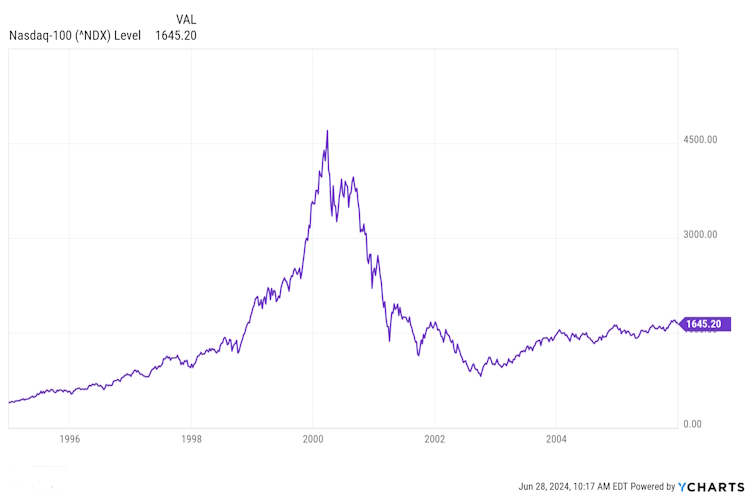
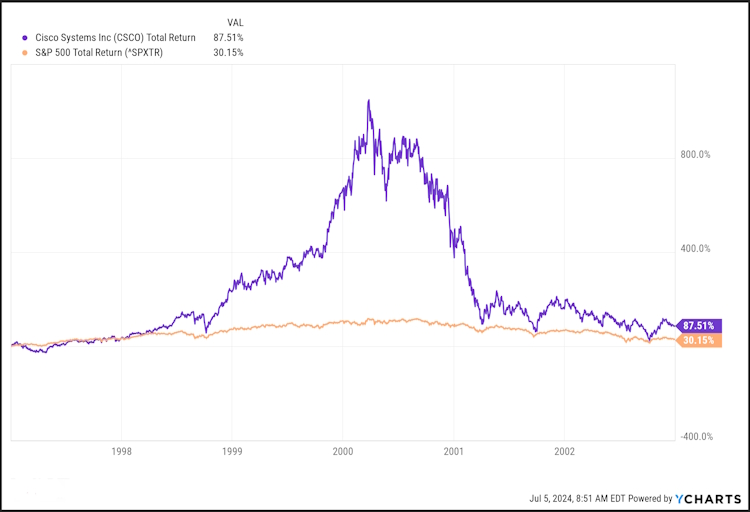
What we are seeing today is very similar to what we saw in the late 90’s when it became clear that the internet would have a growing presence in our economy. Powered by a growing army of online traders using platforms like E-trade, ScottTrade, and Ameritrade, internet-related companies saw their stock prices soar to unsustainable levels. Many of these companies were not profitable and, eventually, prices and fundamentals began to align closer to historical norms.
It is often said that history doesn’t repeat itself, but it often rhymes. Unlike many of the Internet Unicorns of the late 90s, NVIDIA is growing and profitable, they have reported triple-digit year-over-year sales growth in each of the last four quarters. and earnings grew by 790% over the past year. Still, by many measures, its price has gotten ahead of the performance of the company.
For example, NVIDIA’s Price to Sales ratio (P/S), is presently around 38 but had been in the 40s before the latest pullback. Price to Sales is a simple ratio that tells us how much investors are paying for a dollar of sales. So, anyone buying NVIDIA stock today is paying $38 for every dollar of sales NVIDIA generates. By comparison, here are the current P/S ratios for the other members of the Magnificent 7:
- Alphabet: 7.4
- Amazon: 3.5
- Apple: 8.6
- Meta: 9.2
- Microsoft: 14.0
- Tesla: 6.6
The P/S ratios of the other six average out to 8.2, which implies that if NVIDIA were to trade in line with the other six companies, its price would have to drop to around 80% from where it’s trading today. Although it’s worth noting that if we accept the sales growth estimates currently in place for Nvidia, the P/S ratios grow much closer looking out as little as two years into the future, meaning that the price would remain flat while sales caught up. As we have quoted before, in the short term the stock market is a voting machine, but in the long term it’s a weighing machine and eventually the scales will be brought into balance one way or another.
To be sure, there are other metrics involved in the valuation of the stock of any company. Our own favorite valuation metric, Cash-Flow Return on Investment, indicates that the stock price could go higher. Still, artificial intelligence is an investment meme right now. NVIDIA’s current rate of sales growth won’t last forever, and it may only take one bad quarter to turn the Fear of Missing Out into the Fear of Loss and send the stock price lower.
Growth Investing is exciting when it’s working but it can be devastating for people counting on annual growth to keep up with their spending. This is a concern that we have echoed repeatedly since we started composing our client letters.
In a recent article on the website Tradethatswing.com, Cory Mitchell makes the point that
The US stock market has a long history of producing double-digit yearly returns. The average yearly return for the S&P 500 is 10.64% over the last 100 years.
However, while these statistics can make it seem like the stock market marches higher almost every year, stocks tend to move sideways quite a bit of the time. Averages of any kind can be deceiving and a 10% average return for an index doesn’t mean you make 10% each year. Some years you are making 20% or 30%. In other years, you watch your account drop, and in other years all you get are dividends with no gains.
As highlighted in the graph below, most of the progress in the stock market over the last 150 years has come in three big moves: mid-40s to mid-60s, 80s-2000, and 2010 to now. The rest of the time stocks moved sideways, with little growth, sometimes for decades. During such times, dividends would be the only return.
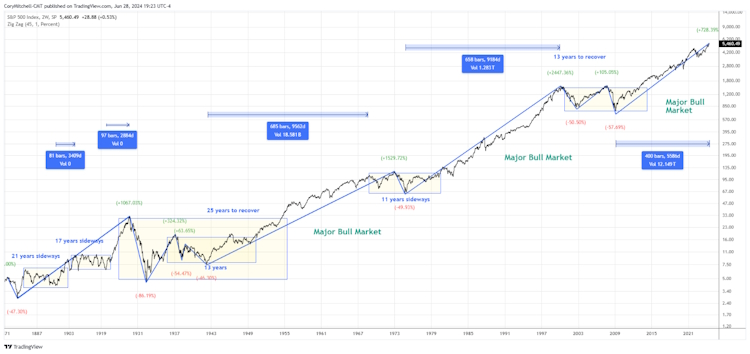
For those who would like to access this graph, here is the link – Historical Average Stock Market Returns for S&P 500.
Over the long term and depending on when you started, U.S. stocks might return 10% a year on average. But in any given year, their performance could diverge from that average quite dramatically. The table below lists some of the market’s biggest annual wins and losses during the modern era.
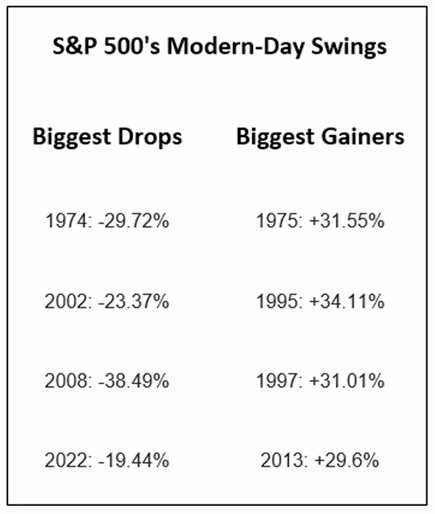
Imagine needing to withdraw some of your money at a time when your portfolio has lost a third of its value, or just simply sitting through a period when your portfolio loses a third of its value. Many people have found out the hard way that they’re not able to stomach market volatility and they end up pulling chunks of money out of the stock market and locking in those losses for good.
Nobody can predict the length or severity of a downturn. In 2020, we believed that the sell-off was panic-induced, not helped by the various experts and news outlets who seemed to contradict themselves hour by hour. Once the general public figured out that COVID was not going to end life on earth and that oceans of government stimulus were flooding the world economy, stocks quickly recovered and headed to new highs.
Downturns like the 2008 Housing Bubble lasted a lot longer and the recovery was much slower led by the Nasdaq 100 in the “new normal” of ultra-low interest rates (green line) that lasted until 2022.
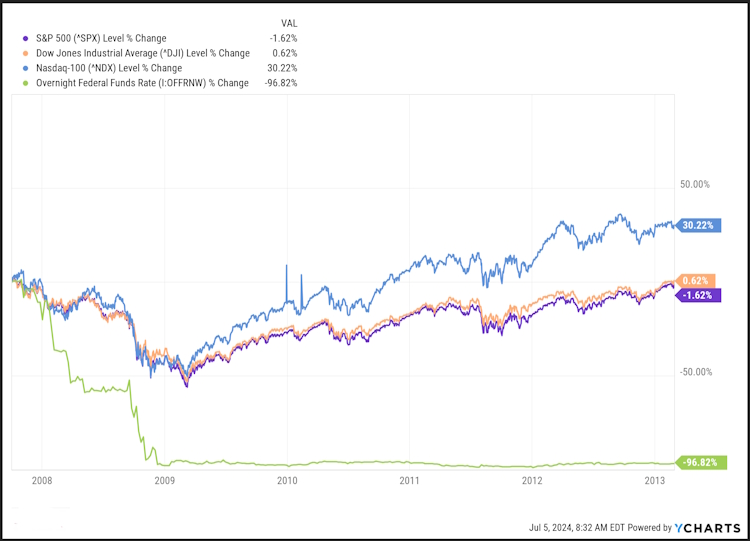
All three indices dropped in 2022 but started to turn around in October of that year after the Fed announced a “pause” in their interest rate hikes and has since recovered to new all-time highs in 2024 with great fanfare.
There’s just one inconvenient fact that these celebrations ignore.
Back to Inflation
Above, we spoke about the impact of inflation on our daily cost of living, but we also have to consider the impact of inflation on our investment strategies.
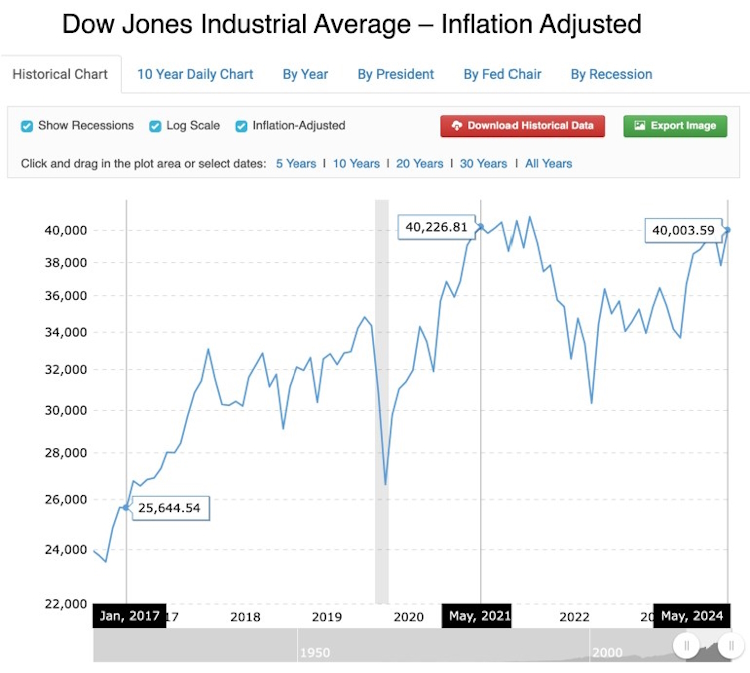
Starting with the Dow Jones Industrial Average which topped $40,000 for the first time since May of 2021, when inflation is factored in, the Dow has been flat for the past three years (see chart below).
In his Tradethatswing.com article mentioned earlier, Mitchell reports similar findings, noting that.
The historical average yearly return of the S&P 500 is 14.61% over the last 5 years, as of the end of May 2024. This assumes dividends are reinvested. Adjusted for inflation, the 5-year average stock market return (including dividends) is 10.08%.
US Stock Market 5-Year Average Return
- Annualized Return (including dividends): 14.606%
- Annualized Return (including dividends) Inflation Adjusted: 10.081%
- Annualized Return (no dividends): 12.895%
- Annualized Return (no dividends) Inflation Adjusted: 8.438%
In other words, inflation has reduced returns (with or without dividends) by more than 400 basis points over the last five years. If you’re planning to retire on your capital gains using the still oft-quoted 4% rule, you could be digging a hole that you may not be able to get out of without substantial trade-offs, especially in your later years.
Does this mean we ignore growth? Absolutely not, we invest for growth by finding companies with strong fundamentals such as low debt, growing revenue and earnings, and not just a surging stock price. Many of these companies pay dividends, others do not.
For those who have time, dividend reinvestment strategies can have a big impact on your investments. Currently, there are over 260 companies with safe or very safe dividend ratings that have increased their dividends by at least 5% over the last 20 years. Out of that list, over 200 of them have a five-year growth streak of over 5%.
That gives us more than enough candidates for a well-diversified dividend-income portfolio.
For cash needs in less than five years, we can use bonds, cash equivalents, or even cash to provide some return while making sure the principal will be there when it’s needed.
Having a solid mix of different assets can help smooth out the annual ups and downs of the various markets, give you liquidity no matter what’s happening, and with proper management, can even keep your wealth growing.
There are three general threats to financial independence and a comfortable retirement: longevity, inflation, and market volatility. This is why we start with the financial snapshot, so that investment allocations can be better aligned with both short and long-term cash flow needs.
Like most endeavors, the pursuit of financial independence is a balance of paying attention to what is happening now to prepare for what will happen next. Most individual investors are solely focused on what’s happening now:
Dot Com
Pot stocks
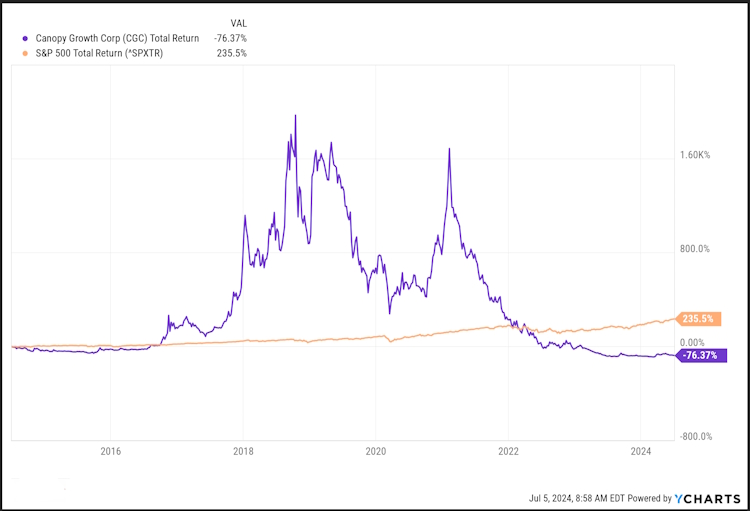
Blockchain
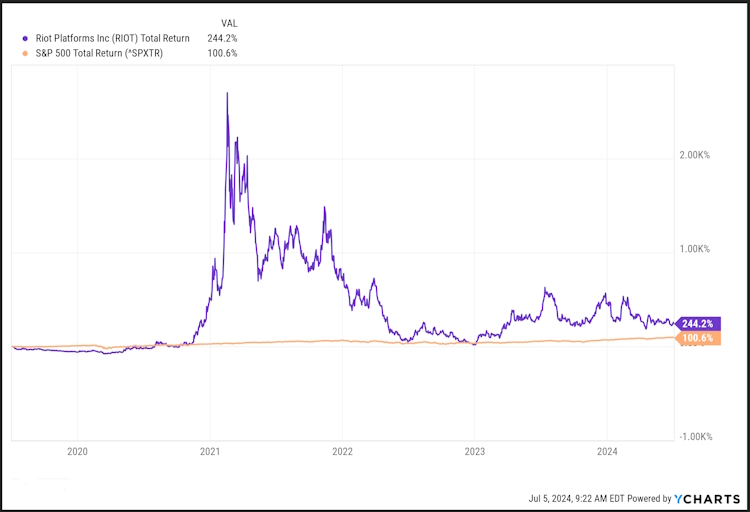
Electric Vehicles
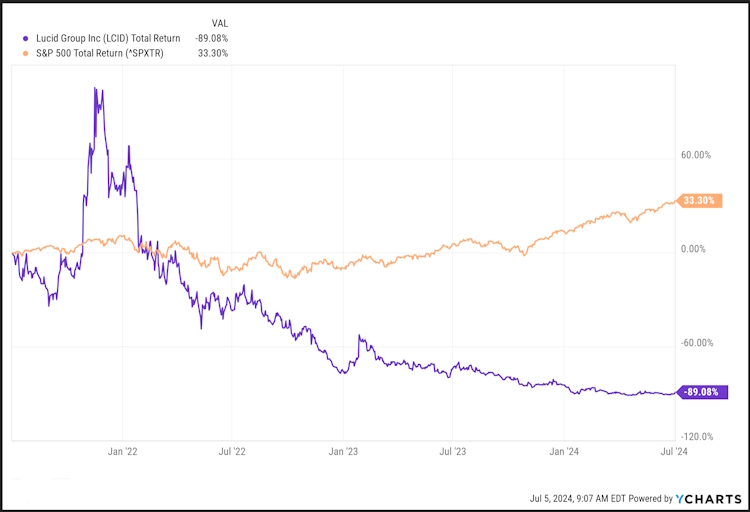
AI?
Chasing price action is one reason why the average investor underperforms the market by a wide margin.
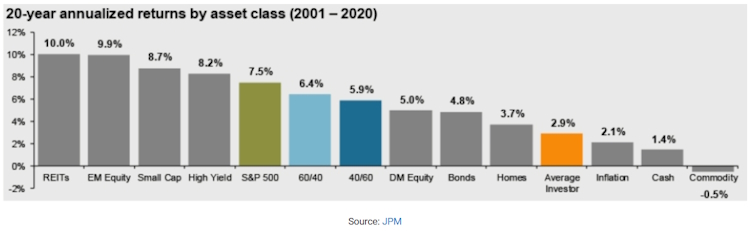
While we all know “of” someone who put all their money in XYZ stock and became a multi-millionaire “overnight,” very few of us actually know someone who’s done that. If everybody’s stories in the breakroom or on the golf course were true, we would likely see the Average Investor (orange above) lined-up between the S&P 500 and the “60/40” allocation. Most often, the big gains we hear about makeup only half the story.
Recent findings indicate that 56% of American workers feel behind where they think they should be on their retirement savings, including 37% who feel “significantly behind,” in this, arguably the most prosperous nation on the planet.
Building wealth and achieving financial independence is a slow, deliberate, aggravating, and even boring process. It begins with asking “What’s Next” – career change, early retirement, replacing your paycheck, inflation, future tax policies, and potential illness, – and takes advantage of identifying “What’s Now” to position yourself for managing through future uncertainties.
Our goal is not to beat a market index or our neighbor’s portfolio in any given year. Our goal is to help our clients achieve their individual financial goals over the long term with as little risk as is required to do so. Just this month we are celebrating two clients who are making the transition to retirement. It took some work to get there and for us the work isn’t over as some retirements can last longer than a career.
But to be able to say to them “congratulations” is so much more rewarding than beating an index.
As we celebrate Independence Day this week, we are thankful to live in a part of the world where such an ideal is still possible.

