A Confluence of Unfortunate Events
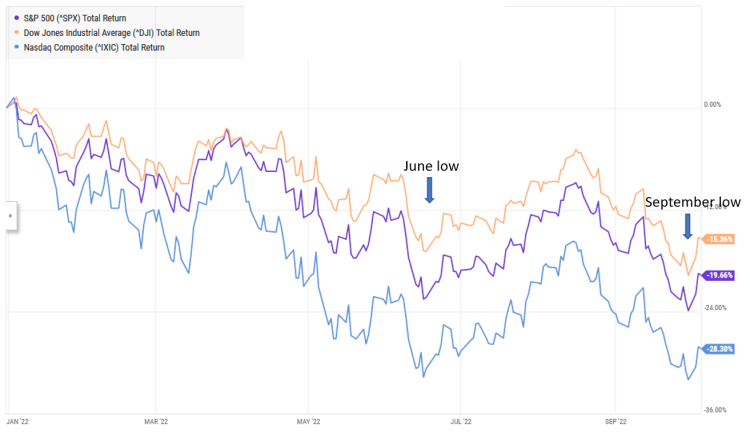
All three major indices ended the third quarter about where they started. Despite the stomach-churning volatility it took to get there, it took declines the last two days of the quarter to breach the lows we previously hit in June.
We have now experienced three technical bear markets in the last five years, which is a bit unusual according to the people at Hartford Funds who state that the average frequency since 1929 is 3.6 years:
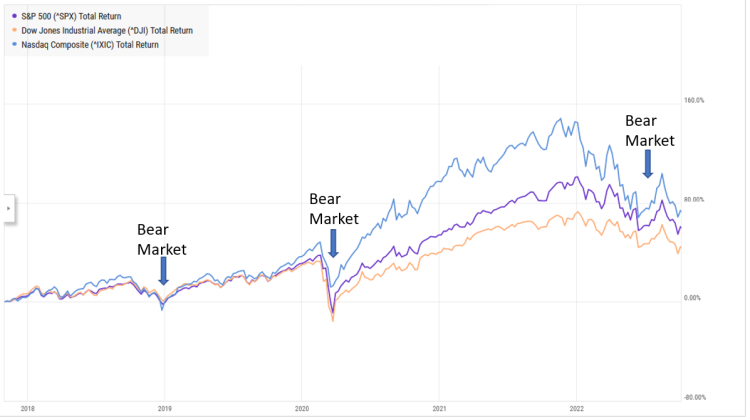
While financial experts may argue, as they did in 1990 when a drop of 19.9% was not deemed to be an official bear market, that 2018 was not an official bear market because the lows were hit intraday instead of at the end of day close, anyone with money in the market knows that technicalities don’t matter when your account is down.
Not wishing to sound like a broken record, the main driver of market volatility is still the Federal Reserve and its response to the current economic climate. Below is a chart of the S&P 500 price movement (blue line) with change in the federal funds rate (orange bars) over the past year from macromicro.com
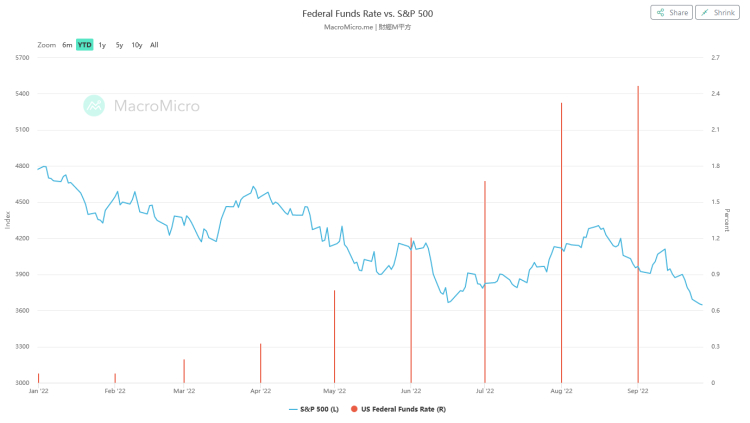
You’ll notice that the market started dropping in advance of the increase in the fed funds rate and that is because the yield on the 10-year Treasury Bond had already started moving up in December of 2021 as the Fed “pivoted” to a more hawkish stance. From U.S News:
“The central bank also signaled it could raise interest rates sooner than it had earlier forecast, with the possibility of three hikes during 2022. The “Powell pivot,” as it has been coined by economists, came after Chairman Jerome Powell was nominated for another term by President Joe Biden.”
While changes in the fed funds rate are limited to the scheduled Federal Reserve meetings, Treasury Bonds are traded on the open market. Investors hearing talk of rising rates will react to a change in policy by selling their bonds, which lowers prices and increases yields. The inverse relationship between stock prices and 10-year yields is illustrated in the chart below courtesy of alphacast.com:
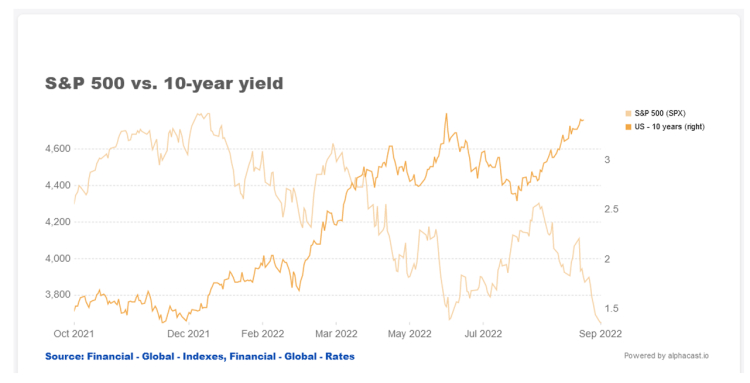
We wish they would use more contrasting line colors! Nonetheless, the chart shows that as the 10-year yields (dark orange) began to increase, the S&P 500 Index (light orange) rolled over and hit lows corresponding to the highs in the yield in June and now in September.
With that in mind, it was no surprise that the latest blow to the market came on Wednesday the 21st following the Federal Reserve policy decision to raise interest rates by 75 basis points.
The 0.75% increase had been telegraphed for weeks and was likely priced in the market by the traders and trading algorithms. However, the market was not prepared for the change in the forecast that came out of the meeting. The Fed updated its economic projections and now call for a year-end median target rate of 4.6% which is a full 1.0% higher than June’s projections.
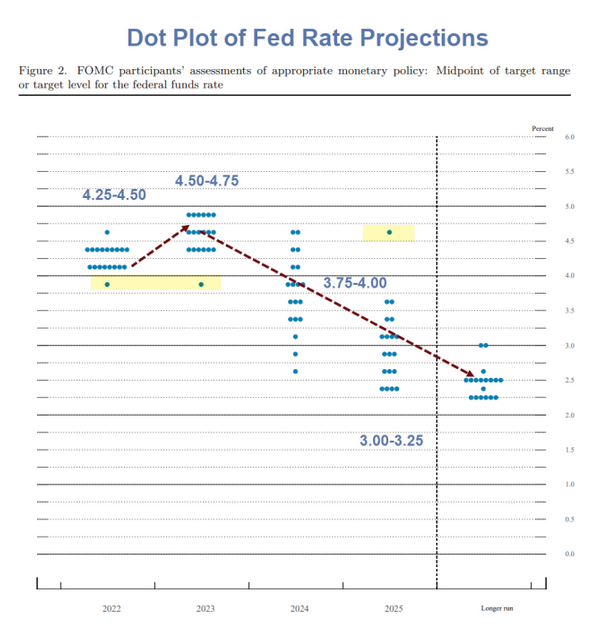
This change in the interest rate outlook spooked the markets. Up to this point, many investors believed that the Fed was near the end of its tightening. Earlier statements by Fed policymakers indicated target rates of 3.5% to 4% by the end of this year. Before September 21st, the Federal funds rate was 2.50%. The expected September increase of 0.75%, therefore, would bring the rate to within 0.25% to 0.75% of target. So, prior to this change in expectations, the markets were pricing in probable increases of 0.50% in November and 0.25% in December with at least a pause in further increases heading into next year.
The new year-end target rate now implies a likely and unprecedented fourth 0.75% increase in November followed by another 0.5% hike in December assuming that the Fed doesn’t change its mind again.
There are two things that rattle the markets: uncertainty and surprises. The Fed’s surprise comments caused the market to recalibrate the impact of higher projected rates and begin considering the risk that the Dot Plot may change again in November.
Adding to the uncertainty is the pace of the rate hikes. In an article from Bankrate, looking at Fed funds rates since the 1980s, increases of 0.75% or even 0.5% have been extremely rare with 0.25% being the overwhelming norm through four decades. As seen in the table below, the current pace of rate hikes is truly aggressive by recent standards.
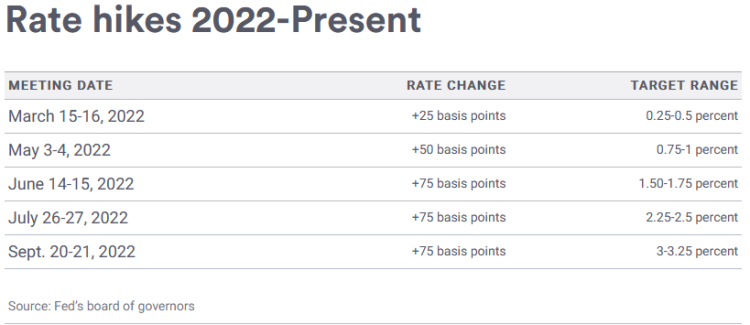
According to several economic studies, it takes about six to nine months for a Fed Funds rate hike to work its way through the economy. Assuming that to be true, the impact of the March rate hike is only now beginning to be felt.
In other words, it will be another six to nine months until we see the cumulative economic impact of the last five rate hikes. As the Fed has a reputation of being wrong more often than it’s right, there is a high risk that it overshoots and pushes the U.S. economy into a deeper recession than anticipated. All this contributed to a sudden and violent sell-off sending 10-Year yields close to 4% and taking the S&P 500 back down to its June low.
Until the risk of more surprises subsides, the market will likely remain volatile and highly responsive to any changes in rates.
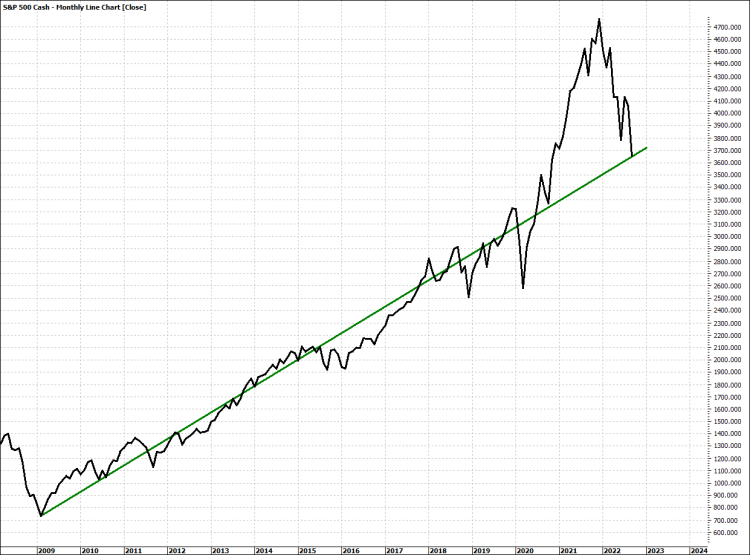
Taking a little longer perspective, you can see that the uptrend in 2021 was really a case of the market going too far, too fast and only now coming back to the longer term trendline which started at the end of the 2007-2009 bear market.
This is similar to the 2000 – 2002 bear market during which prices fell back to the longer term trendline starting from the 1987 bear market low.
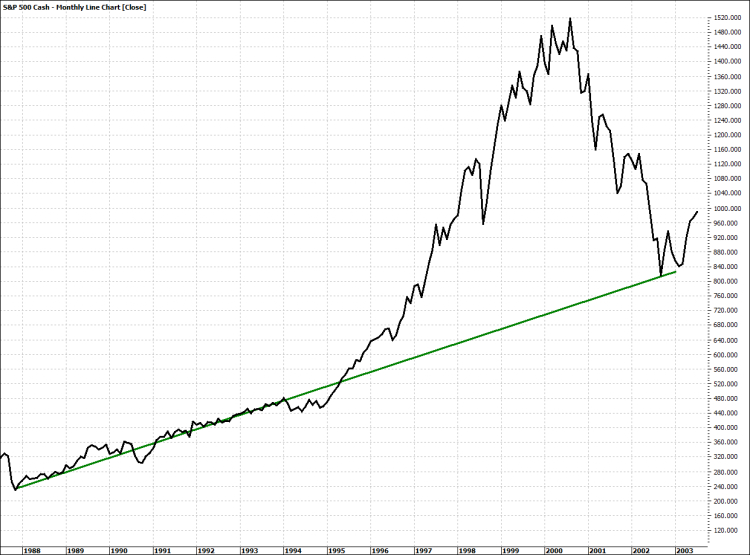
Many pundits refer to these events as the “popping” of market bubbles and, to some degree, that is a fair description. In the case of the mid to late 1990s, 401K plans were becoming more broadly accepted and a good portion of that money went into the stock markets. That, combined with the advent of online trading and the surge of investors buying into any internet related company (the “dotcom” mania) produced an unsustainable trend. Warren Buffett described the phenomenon this way during a speech in September, 1999:
“The fact is that markets behave in ways, sometimes for a very long stretch, that are not linked to value. Sooner or later, though, value counts.”
More recently, huge sums were driven into the stock market due to the combination of stimulus money from the government’s response to Covid, a zero/low interest rate environment, and a fixation on technology related growth stocks.
In each case, investor fear of missing out (“FOMO”) on stock market riches is a powerful emotion when the markets are rising and is equaled only by the fear of losing everything when markets tumble. Unfortunately, too many people have short memories and let their emotions get the better of them, especially during rapidly moving markets.
Somewhat tongue in cheek, we refer to our “looking forward “portion of the letter as “Things Keeping Us Awake”. Unfortunately, we have recently found ourselves waking around 2:00 AM unable to fall back asleep as our brains start relentlessly processing all the news and events from the previous day.
Nuclear War
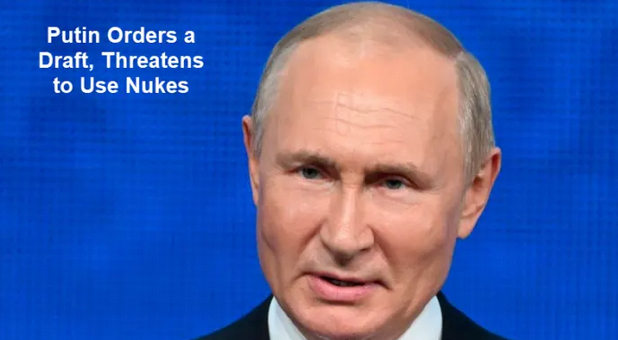
It is rumored that Barack Obama once referred to Russia as a “gas station with nuclear weapons”. While we couldn’t find the direct attribution, it does appear that several politicians and dignitaries have made similar comments. Unfortunately, the “gas station” owner is once again threatening to use those nuclear weapons.
It is hard to get a true read on how the war in Ukraine is going, but what is certain is that nothing has gone as Putin planned since the invasion started last February. Like many dictators, Putin has shown no regard for human life as shown through his actions both at home and abroad and he has sole discretion as to the use of his arsenal.
We don’t know where the line is or when it could get crossed, we just know that any time you have desperate people in power, they are often willing to go much further than expected by reasonable people. Putin has amply demonstrated this by his actions this year.
Should we get word of any kind of a nuclear attack, no matter how small, the market will experience a flash crash as the computers go into sell mode in microseconds following any alert. There is little that can be done in a cost-effective way to hedge against nuclear lunacy.
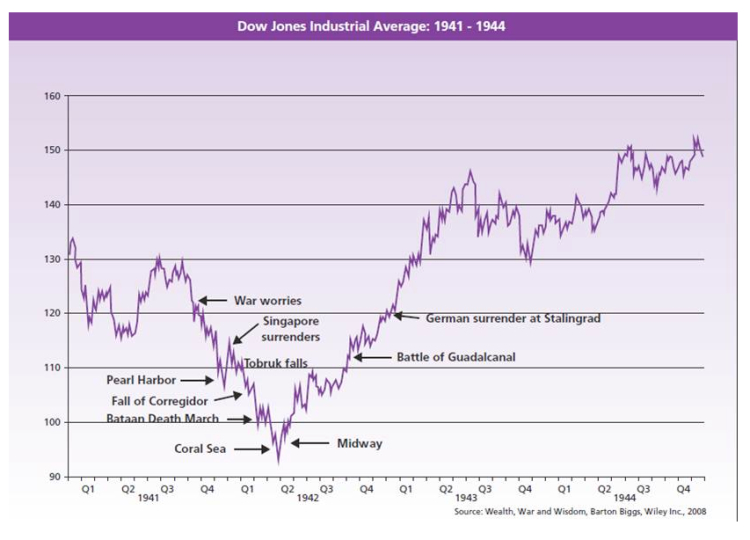
Complex option strategies are expensive and difficult to manage and moving all of your holdings to gold and treasuries until this conflict is resolved leaves you with a large potential opportunity cost if nothing of the sort occurs. We’re not predicting a global war, but perhaps it is at least somewhat reassuring to look at a bit of stock market history.
The Federal Reserve
We’re going to spend more time on this than any other topic this quarter because, right now, the Fed has more influence on short term market moves than anything else. As noted earlier, the Federal Reserve is going to raise interest rates until inflation is under control, even it tanks the economy, period.
There are three things that need to be understood regarding the Fed Governors:
First, they are economists who look at data and seem to believe that by turning certain knobs and levers, they can make changes to the economy to keep it running according to their own ideal. What is lost on everyone is that a degreed economist holds an Arts degree, not a Science degree, and even scientists have problems controlling complex systems.
Second, the Governors are political appointees and, like most politicians, will manipulate the data in a way as to put them in the best light.
Third, they are insulated. Since we first started paying attention to the economy (about the time we were looking for that first job out of college), we have yet to see a Federal Reserve Governor face a layoff because of economic conditions. When they do leave their positions, they quickly move to positions within the same community. Some, like former Fed Chair Janet Yellen, come out of academia while the current Chair, Jerome Powell, came out of a Wall Street investment bank. Almost all of them have Ivy League Degrees and none wind up unemployed let alone broke.
What this means is that Fed policy, which greatly impacts the lives of millions of Americans, is being set by people with a very narrow understanding of how things work in the real world but a very deep view of how they think things work. As such, when faced with rising prices, they don’t look at what might be causing the rise in prices but only look at what they can do to slow down (not reverse) the rise as quickly as they can.
The one tool the Fed has for fighting inflation is raising the Fed Funds rate, which impacts other interest rates. One aspect of raising rates is that it tends to increase the strength of the dollar, which increases U.S. buying power for goods produced elsewhere. However, as we have said over and over, we are not experiencing higher costs because of a weak dollar, in fact, the dollar index is nearing highs not seen in 20 years.
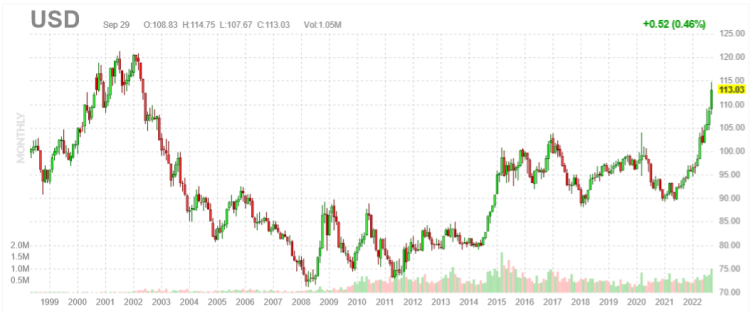
If it is dollar weakness causing inflation, inflation would have been higher in 2008 than it is now. Of course, that’s not the case. We are experiencing high costs because of a lack of supply. This is true particularly of energy, which impacts nearly every area of the economy, and food, which is not only impacted by energy costs but also by market distortions caused by the war in Ukraine.
Despite the rhetoric, we are still not producing the amount of oil that we were pre-COVID.
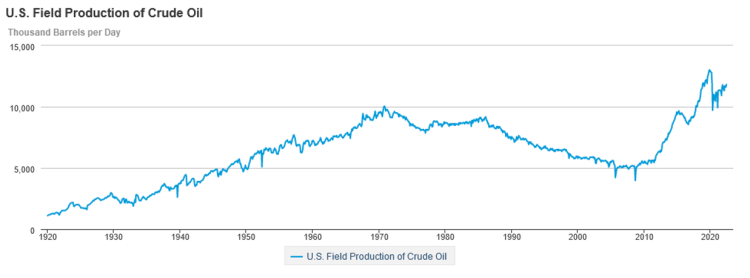
To our surprise, Chairman Powell has made comments about the higher prices being driven by a lack of energy supply, supply chain issues with China, and the Ukraine war, all of which are outside of his control. However, instead of demanding better government responses to these challenges, the chairman has embarked on a crusade to do the only thing he can to combat inflation, which is to raise interest rates.
In other words, if he can’t do anything to stimulate more supply, he will bring demand in line with the limited supply by decreasing demand. With interest rates as his only tool, the only way he can kill demand is by forcing the economy into recession.
There is a calculated method to this madness. First, rising rates impact borrowing costs which include mortgage interest rates. The national average for a 30-year fixed rate mortgage is now sitting around 6.7% compared to 3.0% a year ago, raising the monthly principal payment for an existing home priced at the U.S. median of $410,000 by just over 53%.
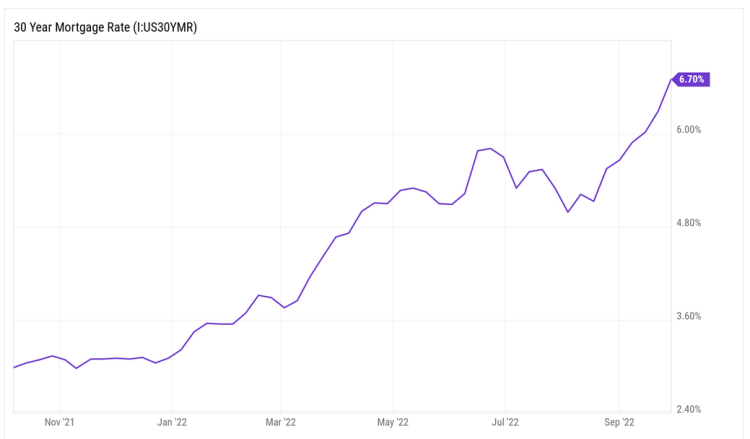
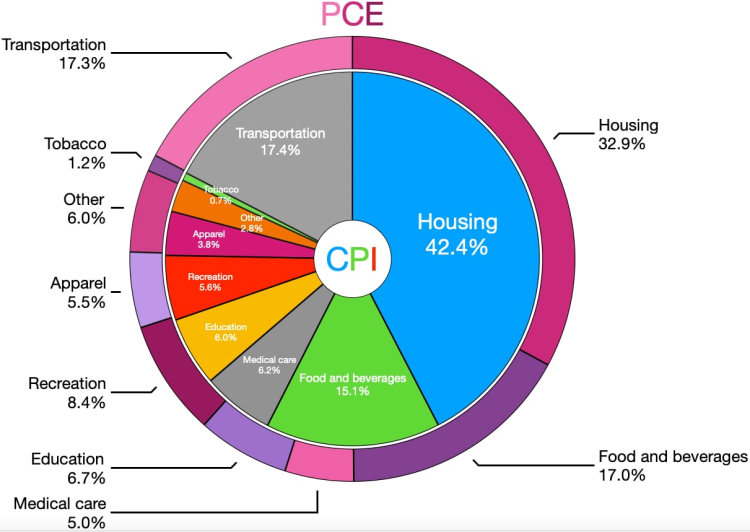
As mortgage payments become less affordable, home prices should begin to stall and possibly drop. Housing makes up 32.9% of the Fed’s preferred inflation measure, the PCE (Personal Consumption Expenditures) Index, and 42.4% of the more widely followed Consumer Price Index.
A slowdown, or even reversal in home prices, will have a large impact on the data the Fed uses to gauge U.S. inflation.
Second, Powell and company also raised the estimate for 2023’s unemployment rate to 4.4% from June’s 3.9%.
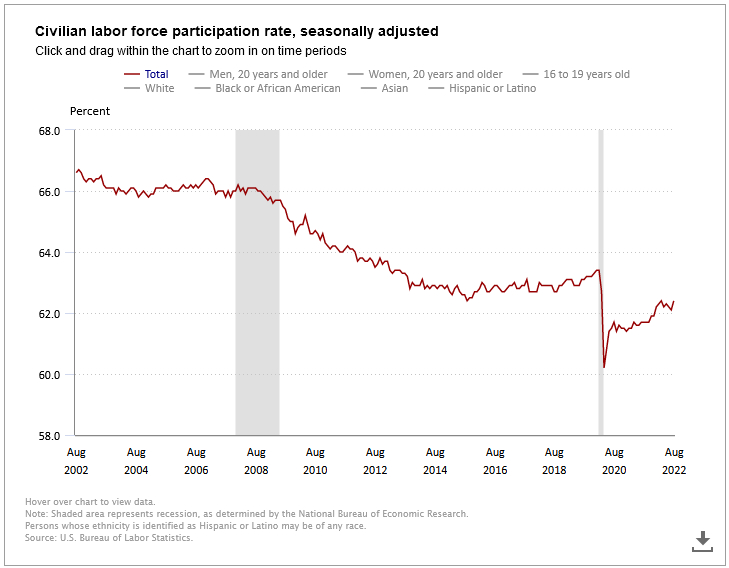
This is based on the nonsensical measure of unemployment that they use. Even though the civilian labor force participation rate has climbed a bit, is still below the historically low pre-COVID levels.
Since the peak in January 2000, the national LFP rate has fallen gradually from 67 percent to 63 percent in January 2020. Both male and female LFP fell between 2000 and 2020, with female LFP falling 2.3 percentage points during that period and male LFP falling 5.8 percentage points. And then there was COVID-19.
The pandemic brought numerous shocks to the labor market, including a significant shock to LFP. After a low of 60 percent in April 2020, early in the lockdown period, the LFP rate has recovered slightly to 62.3 percent as of September.
Demographic shifts explain part of the longer-term decline over the past decades. The retirement of the baby boomer generation—which is expected to be fully retired by 2030—is responsible for roughly half of the pre-pandemic labor force decline. And the pandemic appears to have caused some baby boomers to retire earlier than planned, as roughly 1.75 million baby boomers retired in 2021 versus the typical 1 million per year.
But the decline in labor force participation isn’t just older Americans hanging up their work hats a few years early.
The labor force participation rate for America’s core workforce of individuals ages 25 through 54 has declined 2.2 percentage points since 2000. That translates into 2.7 million fewer workers, and 1 million of that loss occurred just over the past two years, during the pandemic.
This is a concern because, people working is what drives output and fuels innovation. It’s only through work that basic necessities such as food and housing are available and that innovations such as automobiles and smartphones that make our lives easier and more mobile are possible.
Work is also essential to support essential government services, such as national defense and a justice system.
We are already beginning to see employment worsen in the more credit-dependent tech sector where, according to an article by Crunchbase.com:
“…as of late-September, more than 42,000 workers in the U.S. tech sector have been laid off in mass job cuts so far in 2022…”
So, increasing the amount of people out of work will, over the long run, stall the economic recovery. The assumption the Fed is making is that a drop in home prices and more people on unemployment will weigh on economic output. The Fed lowered its 2022 economic growth forecast from 1.7% to 0.2% and their projection for 2023 from 1.7% to 1.2%.
Third, and probably most important, remember that the inflation rate is the percentage increase or decrease in prices over a specified period, most commonly year over year. Inflation surged to a new pandemic-era peak in June, with US consumer prices jumping by 9.1% year-over-year. The probability of prices moderating between now and next June are extremely high as the price of even energy and food commodities are beginning to approach 2021 levels:
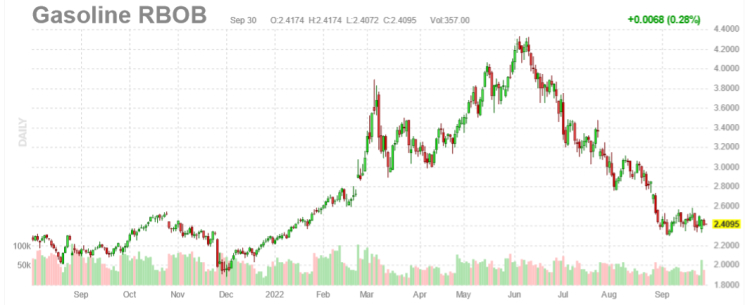
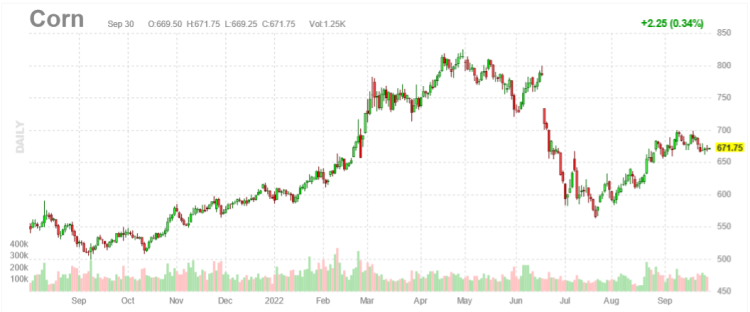
So, the Fed doesn’t need prices to “come down” to declare victory, they only need the increases to be around 2% from the year prior. Therefore, beginning in March of 2023, we should see year over year inflation increases begin to approach that level. As was commonly heard in the 1920s, “the fix is in”.
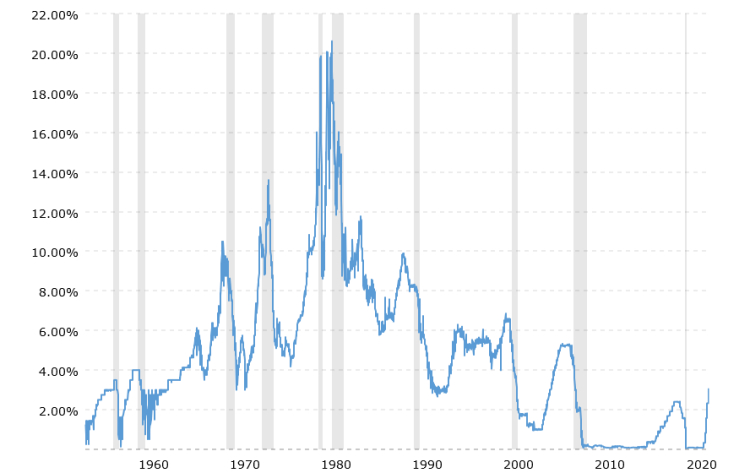
Our take is that Powell is using “inflation” as an excuse to do what he has wanted to do since taking over the Fed, and what should have been done coming out of the 2008 housing crisis. That’s getting interest rates back up to where they were prior to the housing crisis which led the Fed to implement its zero-interest rate policy (“ZIRP”) and quantitative easing (“QE”) to save the banking system and prop up the stock market.
This will give the Fed more room to work in the next financial downturn (even if they cause it), without flirting with zero or even negative interest rates as we’ve seen elsewhere in the world.
Federal Funds Rate – 62 Year Historical Chart
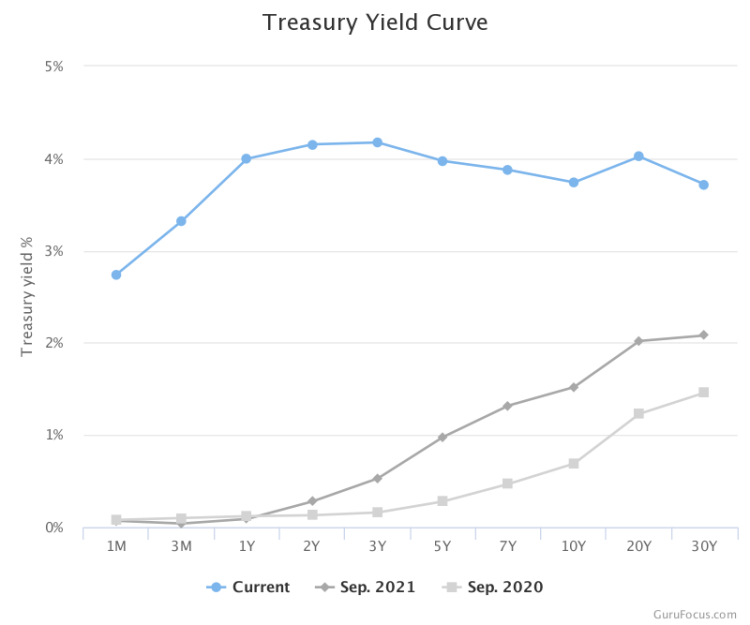
Our main concern is how much damage is going to be done to the economy between now and then. The yield curve, which has predicted the last seven recessions, is inverted at this time and although it’s looking much better than it did in the past week, it is still signaling a recession with the 10-year rate below the 2-year rate.
As we saw in 2020, 2021 and again in 2022, our federal government is all too happy to pass massive stimulus bills before, during and even after recessions. So, if it stays true to form, we could see yet another massive spending bill if the Fed pushes us into a deep and prolonged recession with its policies. If so, a new boom-bust cycle would be the likely outcome.
In the meantime, volatility will remain elevated with every data point associated with housing, employment, and consumer prices impacting daily trading.
A Suisse Lehman Moment
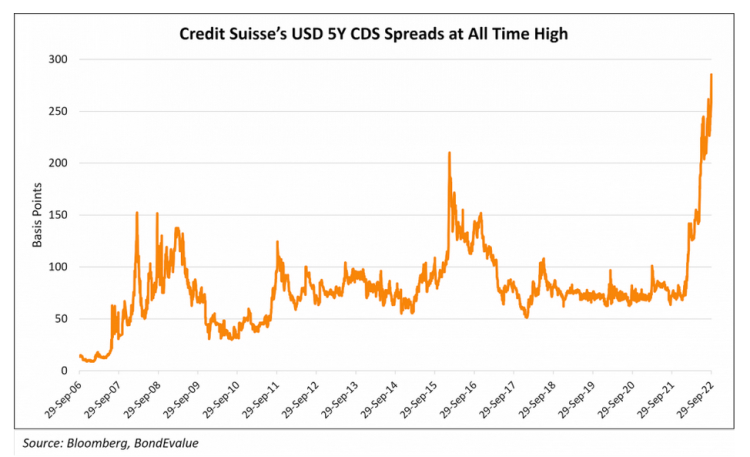
There is panic growing around Credit Suisse as its share price has dropped this year by 55% after the bank suffered over $5 billion in losses on complex derivative deals with the family office hedge fund Archegos Capital Management. From ABC News: “Archegos went belly up in March of last year. Credit Suisse’s reputation took another hit from its involvement in the Greensill Capital scandal.”
According to the Financial Times, “The two issues that appear of most concern to investors, are the bank’s capital position, which reflects its ability to absorb losses, and its liquidity levels, which would be put to the test in periods of short-term stress. The bank insists that neither presents a risk.”
Looking back at history, those were the top two concerns about Lehman Brothers in September of 2008, and which led up to its ultimate collapse. Lehman’s failure kicked off a nasty sell-off and resulted in the infamous “bailout” of “too big to fail” banks.
“Credit Suisse is a global, systemically significant, “too-big-to-fail bank” that operates in the U.S. and is deeply interconnected throughout the global financial system,” warns Dennis Kelleher of watchdog group Better Markets.
“Its failure would have widespread and largely unknown repercussions from the inconvenient to the possibly catastrophic.”
We pray that the financial system has learned lessons from the 2008 financial crisis and that mistakes from then won’t be repeated now. But unfortunately, we won’t know until it’s too late and right now the bond market is not signaling a high degree of confidence.
The Collapse of EU Economic Growth
The European Union was formally established in 1993 and started out as a seemingly harmless organization stressing economic efficiency, trade, and a common currency. Even though the seven decision-making institutions located in Brussels were limited by the original treaties to powers expressly conferred to them by the member states (now numbering 27), over time they have managed to expand their power and influence (including on energy policy), often to the detriment of individual members.
Many economists who are outside of E.U. influence have considered it to be an economic basket case even though, collectively, it represents about $17 trillion in GDP and a close third to the U.S. and China in its contribution to the world economy.
Sanctions against Russia have exposed the most acute problems of Europe which is rapidly losing its economic power. In an article written in Oriental Review:
“In Britain 60% of enterprises are on the verge of closing due to higher electricity prices. This is reported by the analytical group Make UK, representing the interests of British industry. 13% of British factories have reduced working hours and 7% are temporarily closing down. Electricity bills have risen by more than 100% compared to last year.
In Germany, according to the Leibniz Institute for Economic Research, the number of firms and individuals that went bankrupt in August alone rose 26% compared to the same period last year. The figure was significantly higher than German analysts had forecast. According to experts, during the autumn the number of bankruptcies will only increase. This is connected with the increase of the cost of production processes, in particular with the rise in prices for energy.
Most countries in Europe are in a similar situation. But the authorities are sacrificing the quality of people’s lives in order to continue to exert pressure on Russia.”
During the last decade, Germany alone spent nearly $500 billion on wind and solar power according to Justin Huhn of Uranium Insider, while shutting down nuclear power plants in response to the 2011 Fukushima nuclear accident. Unfortunately, wind and solar are both intermittent generators of energy requiring ongoing generation of energy from coal and natural gas, which was primarily purchased from Russia.
Now in a report issued September 26th by the Organization for Economic Cooperation and Development (OECD):
“More countries could dip into recession if efforts to diversify natural gas sourcing fall short of what is needed to fuel businesses and heat homes through the winter, according to the report. A cold winter could further drain Europe’s natural gas storage facilities, which have reached between 80% and 90% capacity as of Monday.”
In her annual state of the European Union speech this month, European Commission President Ursula von der Leyen called for energy rationing, and actually used the now infamous phrase “flatten the curve” when speaking about avoiding peak energy demands.
If E.U. citizens, particularly in Germany, the largest single economy in the E.U., are forced to ration energy for an extended period of time, it is likely that a recession could be both prolonged and quite severe, which leads us to our final big concern.
China
It would be one thing for the U.S. to tilt into a recession while the rest of the world remained stable, however, as we noted above, much of the world is in far worse shape. This is not good for China as their economy is still heavily dependent on exporting goods and services to the rest of the world, particularly the U.S. and the E.U.
A significant drop in export activity due to a global recession will have a major impact on a Chinese economy still reeling from a real estate crisis that is yet unresolved.
Several banks have started to cut China’s full-year economic growth forecasts as recent July data pointed toward a significant slowdown. China’s 2022 economic growth outlook was lowered from 3.3% to 2.8% by brokerage firm Nomura, citing additional COVID-19 lockdowns and despite increasing government spending in an effort to stimulate domestic growth.
While it is hard to obtain verifiable data as to the true state of the Chinese economy, we do see daily headlines that indicate to us that things are not following the “Chinese Miracle” narrative.
Why does this keep us up at night? It is because China is being run by Chairman Xi Jinping who is seeking to become the third “President for Life” since the revolution led by Chairman Mao. He certainly wants nothing to get in the way of that, so if economic conditions worsen to the point that his leadership is threatened, he, like Putin, may resort to aggression to stimulate the economy and distract the populace, perhaps just long enough to achieve his consolidation of power. The obvious move would be to invade Taiwan.
With billions of unfunded spending now being directed to the war in Ukraine, the world can ill-afford another armed conflict in the South China Sea.
Conclusion
The future course of the market is quite murky at the moment. But, as we pointed out at the open, despite recent declines, if you started at the beginning of 2018 and simply held a passive ETF that tracks one of the major stock market indices, your portfolio would still show gains for the period.
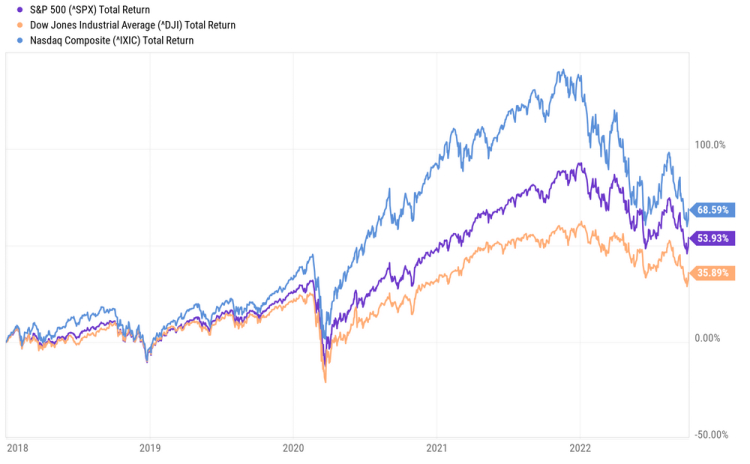
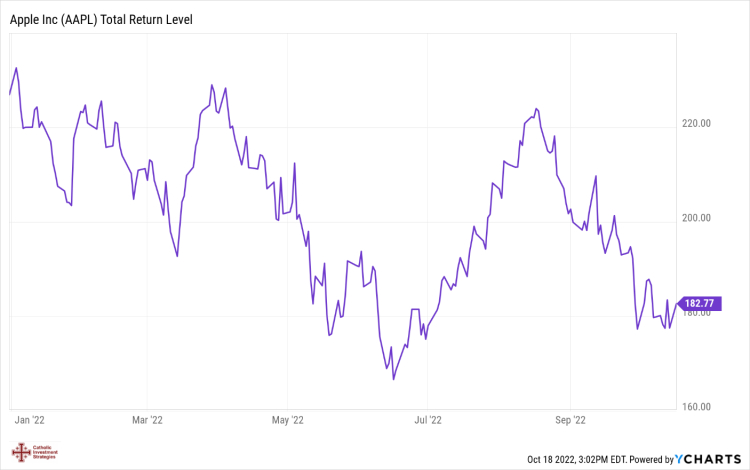
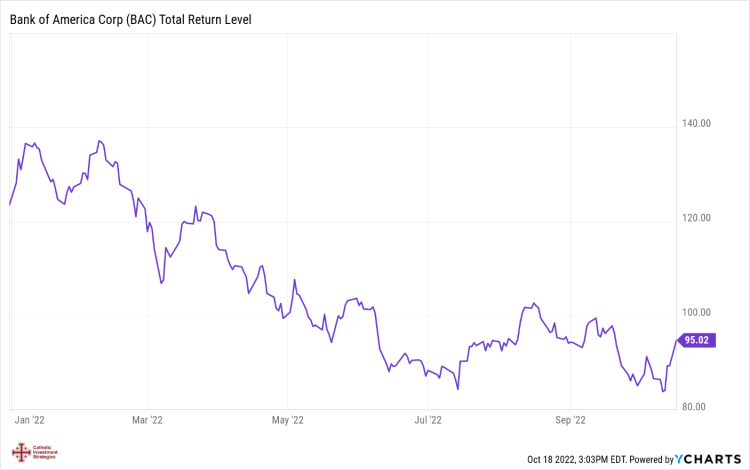
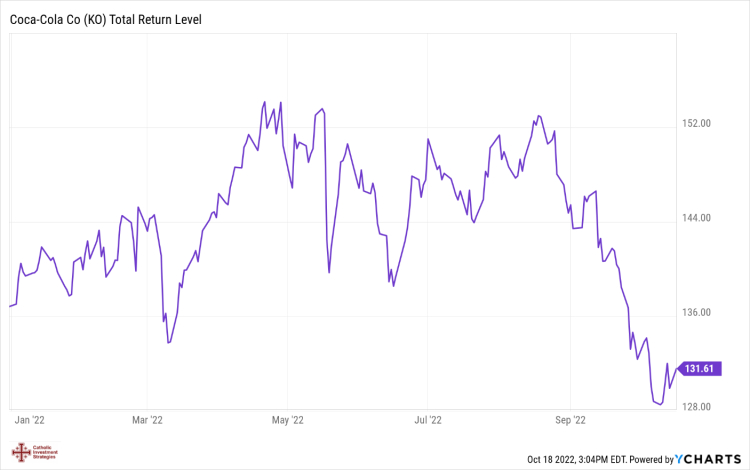
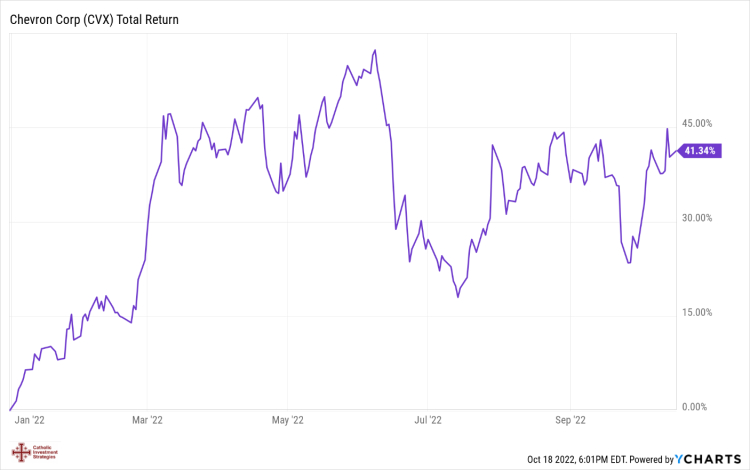
Bear markets can be painful, but overall, markets produce positive returns a majority of the time. Again, according to Hartford, of the last 92 years of market history, bear markets have comprised only about 20.6 of those years. Put another way, stocks have been on the rise 78% of the time and are still the best tool for growing individual wealth. Unlike 2021, where the rising tide lifted all boats, it’s probably a stock-pickers’ market for the foreseeable future. Solid balance sheets, strong cash flows, and prudent governance are likely to separate the winning companies from losing companies in a high interest rate / low growth environment.
Read More
